
Where to from here? How much further is there to go?
The S&P 500 equity index entered a ‘bear market’ during the first half of 2022, meaning the index lost more than 20% of its value from its peak. So while equity markets had a brief reprieve early in the new financial year, many are asking where to go from here for the economy and equity markets, and if markets continue to fall, how much further is there to go?
Of the various factors that affect economies and investment markets, it is the financial conditions that are closely being watched. How loose or tight the financial conditions are, often dictates the spending, saving and investment plans of businesses and households. As such, the financial conditions index may help provide insight into the question – where to from here?
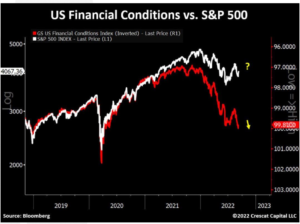
September’s Chart Of The Month shows US financial conditions versus the S&P 500 since the beginning of 2019; this relationship is often very closely aligned. However, financial conditions began to turn down (or tighten) since late 2021/early 2022, while the S&P 500 has not. Creating a gap in the normally very close relationship.
So what does this mean for you?
The gap in the chart does not guarantee further falls in equity markets. However, Morrows believes conditions are likely to tighten, further increasing the chances of further equity market falls. Though this may cause anxiety for investors in the short term, it creates the opportunity to purchase assets at more attractive levels, increasing the chances of higher long-term returns for investors.
How Morrows can help
Morrows Private Wealth’s Strategic Advisory team will help you understand and assess your financial situation and then formulate and implement investment strategies to suit your individual needs.
Now’s an ideal time to discuss and assess your investment approach and take the best action to achieve your financial and lifestyle goals. So reach out, and let’s start the conversation.
Related Posts

What Our Top 10 Best Workplaces ranking means for clients
We are pleased to share that Morrows has been recognised as one of Australia’s Best Workplaces™ in Financial Services &
Federal Budget 2026-27 Update: What You Need to Know Now
The 2026-27 Federal Budget introduced several significant proposed tax changes that will impact investors, property owners and family wealth structures